
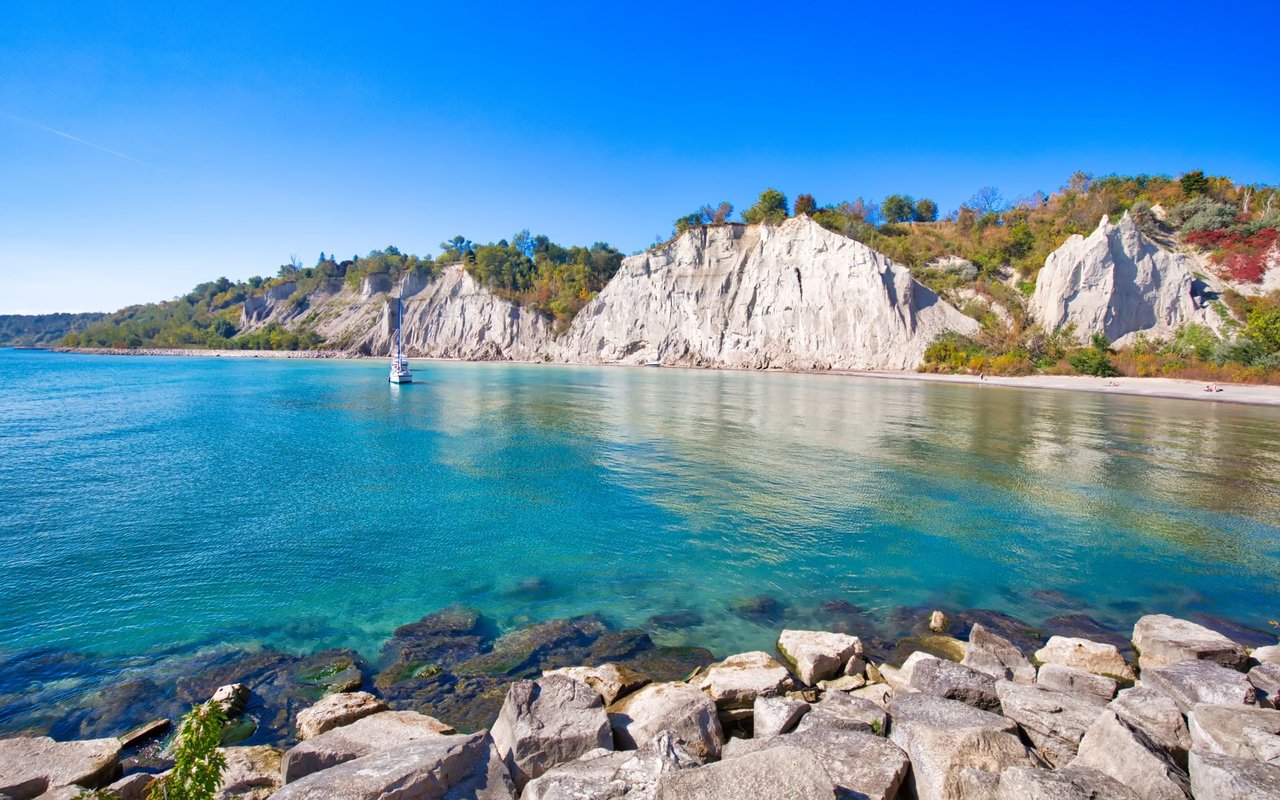
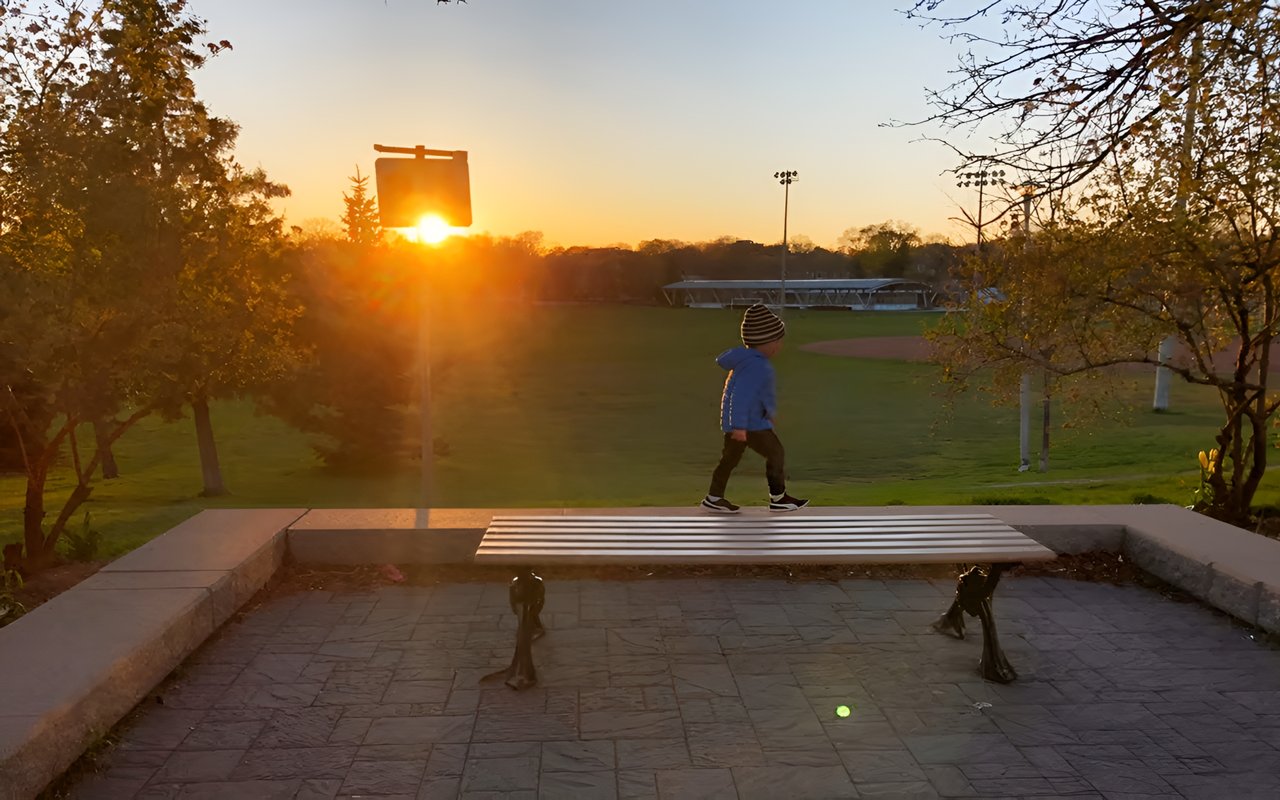
10,647 people live in Birchside/Cliffside, where the median age is 45 and the average individual income is $97,972. Data provided by Statistics Canada.
Total Population
Median Age
Population Density
Average individual Income
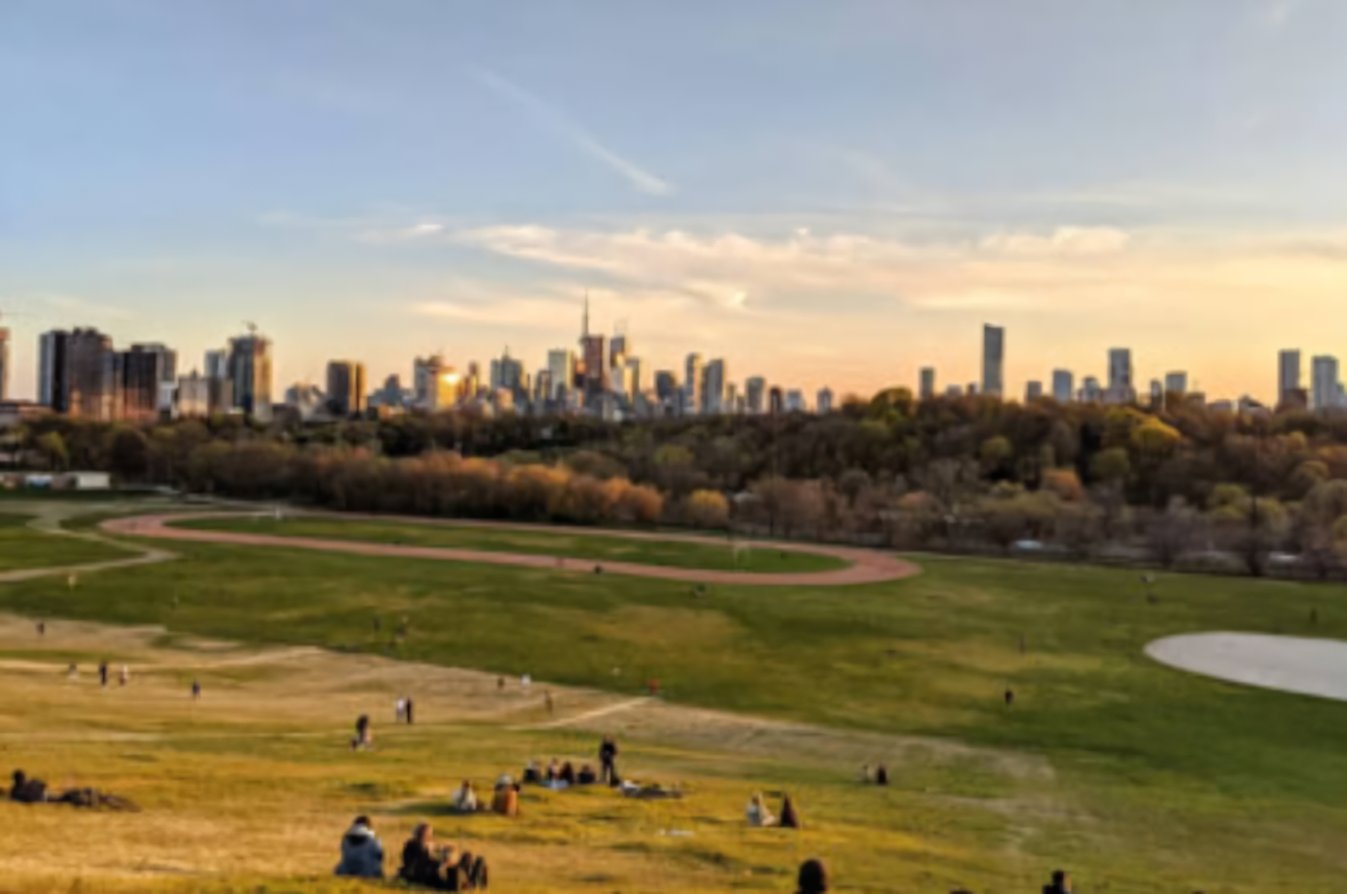
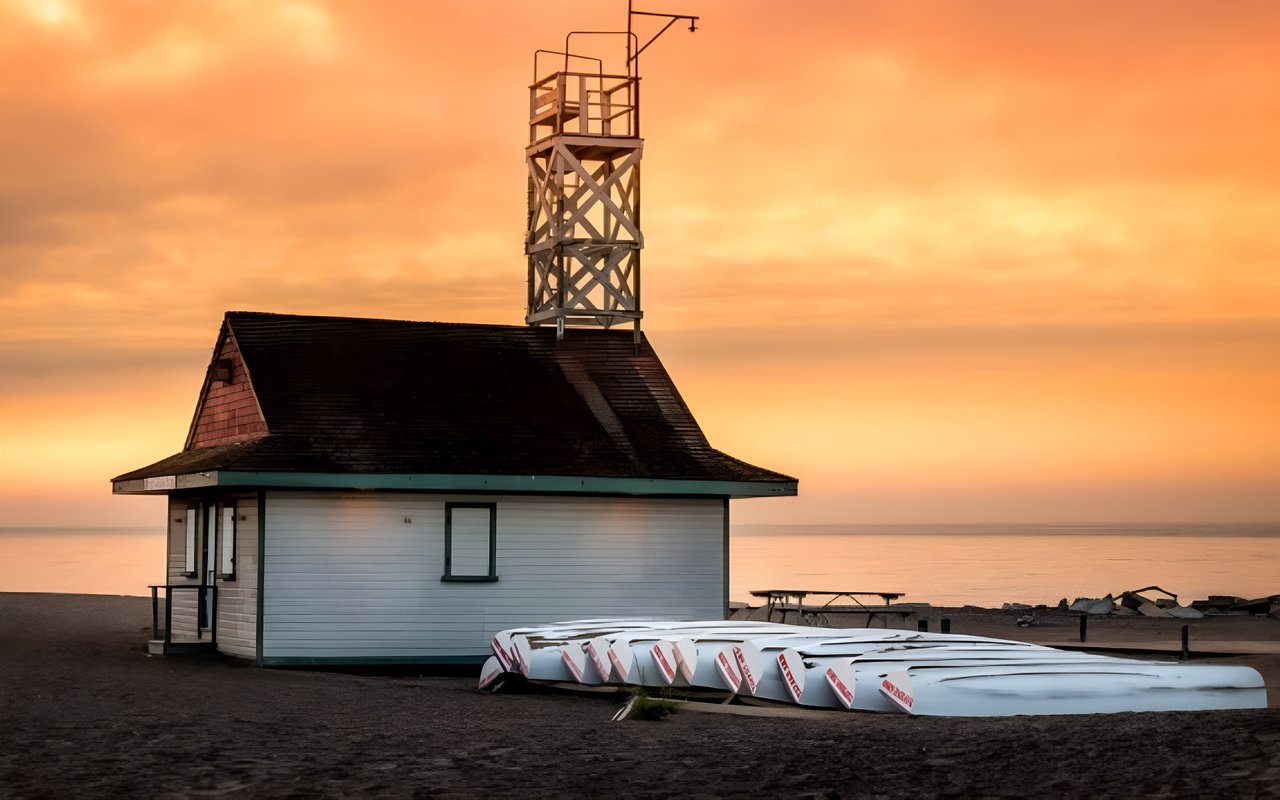
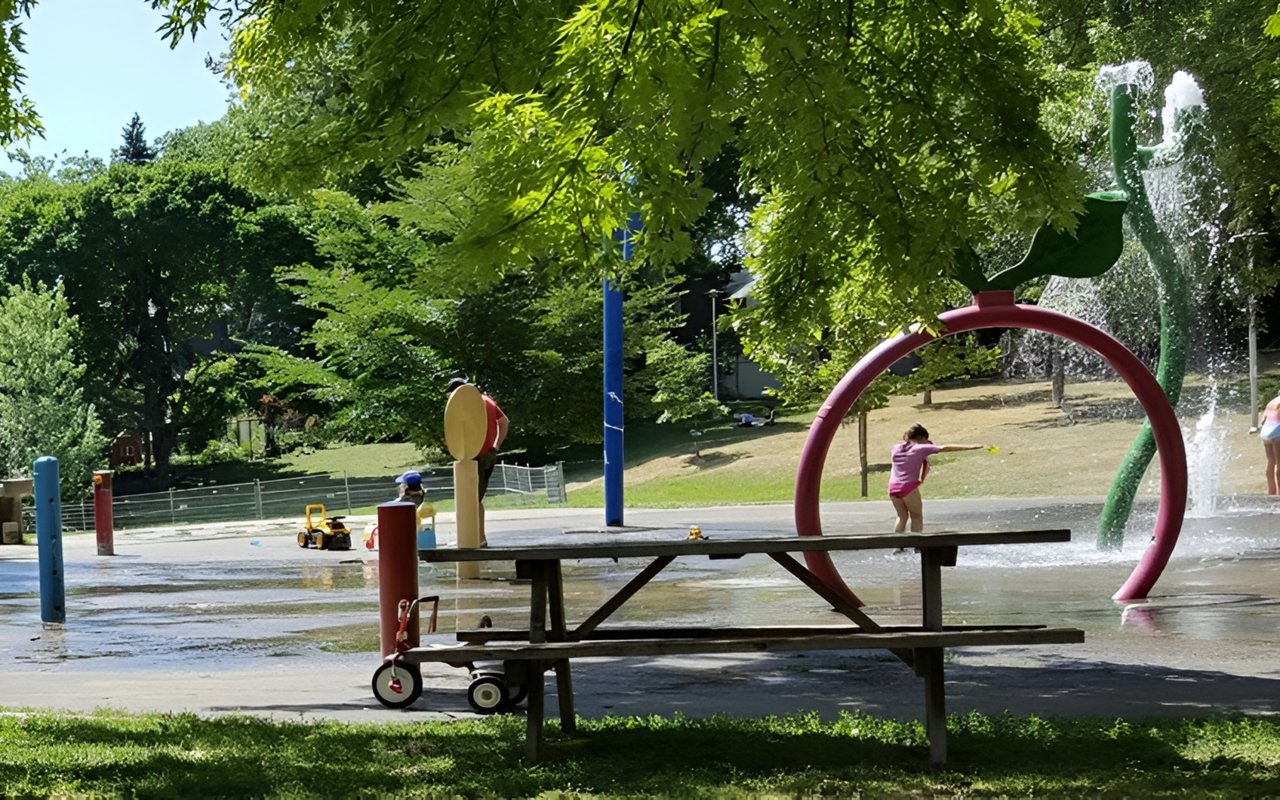
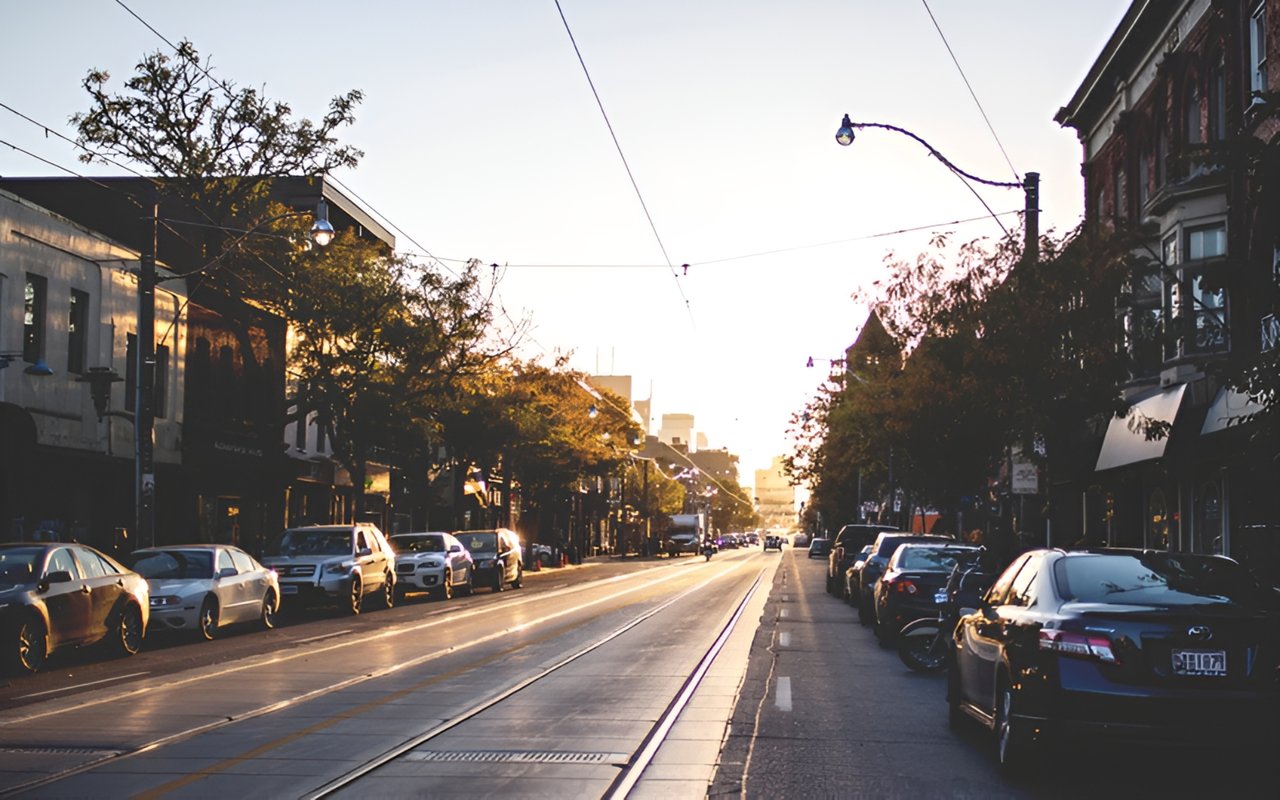
There's plenty to do around Birchside/Cliffside, including shopping, dining, nightlife, parks, and more. Data provided by Walk Score and Yelp.
Explore popular things to do in the area, including Fresh Paint Studio + Cafe, Patio Indian Restaurant, and Roti Galore.
| Name | Category | Distance | Reviews |
Ratings by
Yelp
|
|---|---|---|---|---|
| Dining | 0.37 miles | 5 reviews | 4.6/5 stars | |
| Dining | 4.52 miles | 4 reviews | 4.8/5 stars | |
| Dining · $ | 2.14 miles | 8 reviews | 4.4/5 stars | |
| Dining | 2.87 miles | 2 reviews | 5/5 stars | |
| Active | 2.55 miles | 3 reviews | 5/5 stars | |
| Active | 2.2 miles | 2 reviews | 5/5 stars | |
|
|
||||
|
|
||||
|
|
||||
|
|
||||
|
|
||||
|
|
Birchside/Cliffside has 4,096 households, with an average household size of 3. Data provided by Statistics Canada. Here’s what the people living in Birchside/Cliffside do for work — and how long it takes them to get there. Data provided by Statistics Canada.
Total Population
Population Density Population Density This is the number of people per square mile in a neighborhood.
Median Age
Men vs Women
Population by Age Group
0-9 Years
10-17 Years
18-24 Years
25-64 Years
65-74 Years
75+ Years
Education Level
Total Households
Average Household Size
Average individual Income
Households with Children
With Children:
Without Children:
Blue vs White Collar Workers
Blue Collar:
White Collar:
1945 Queen St E Toronto ON M4L 1H7
1945 Queen St E Toronto ON M4L 1H7